
Turn your data into decisions
AnvikshaBI brings dashboards, spreadsheet-style reports, what-if analysis and scheduled email and WhatsApp reports together, on your own data and shared securely with every team.
Everything from raw data to the decision, in one place
Designers build, viewers explore, and the numbers reach everyone who needs them without anyone exporting spreadsheets by hand.
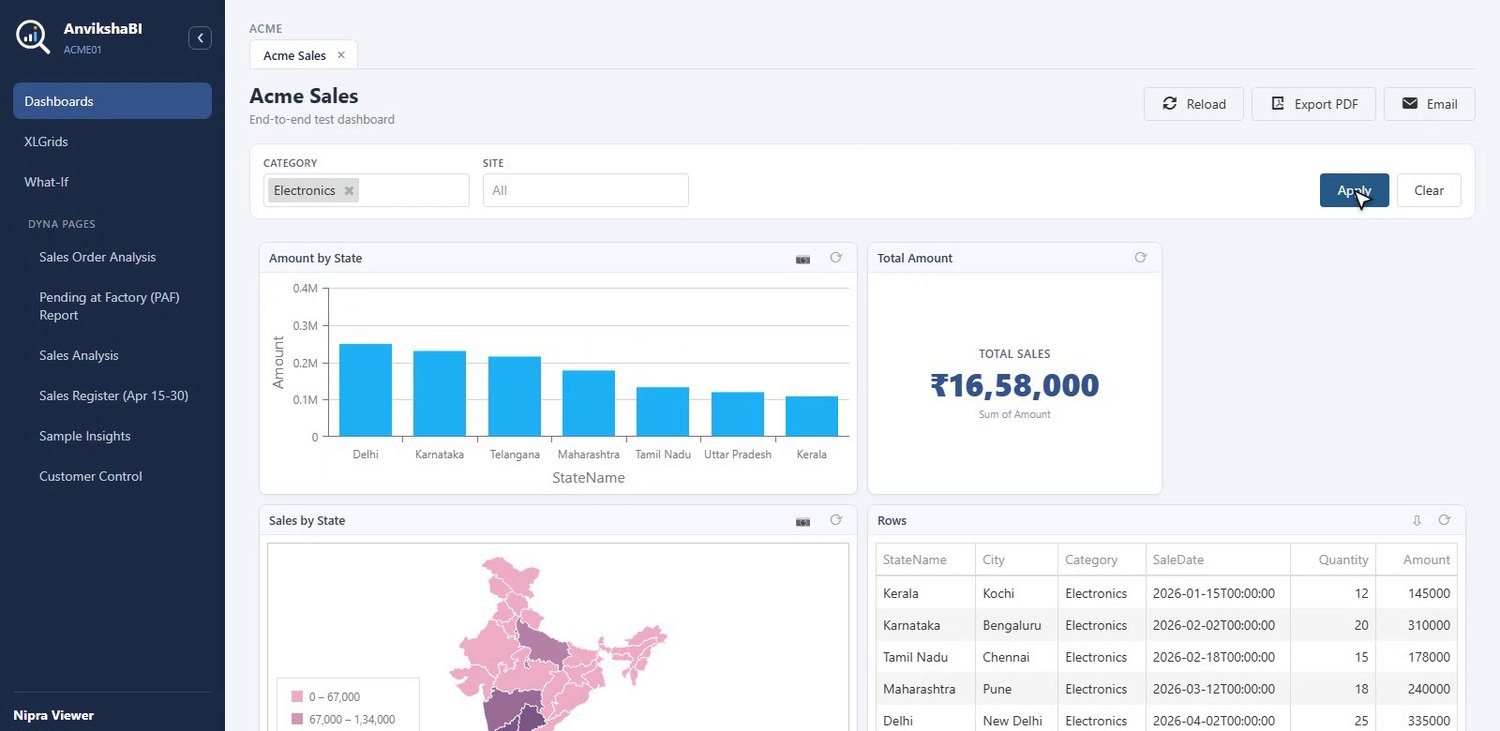
Interactive dashboards
Bar, line, area, pie and doughnut charts, KPI cards, gauges, funnels, pyramids, tree and sunburst charts, data grids, pivot grids and an India map, with filters that act on every widget at once.
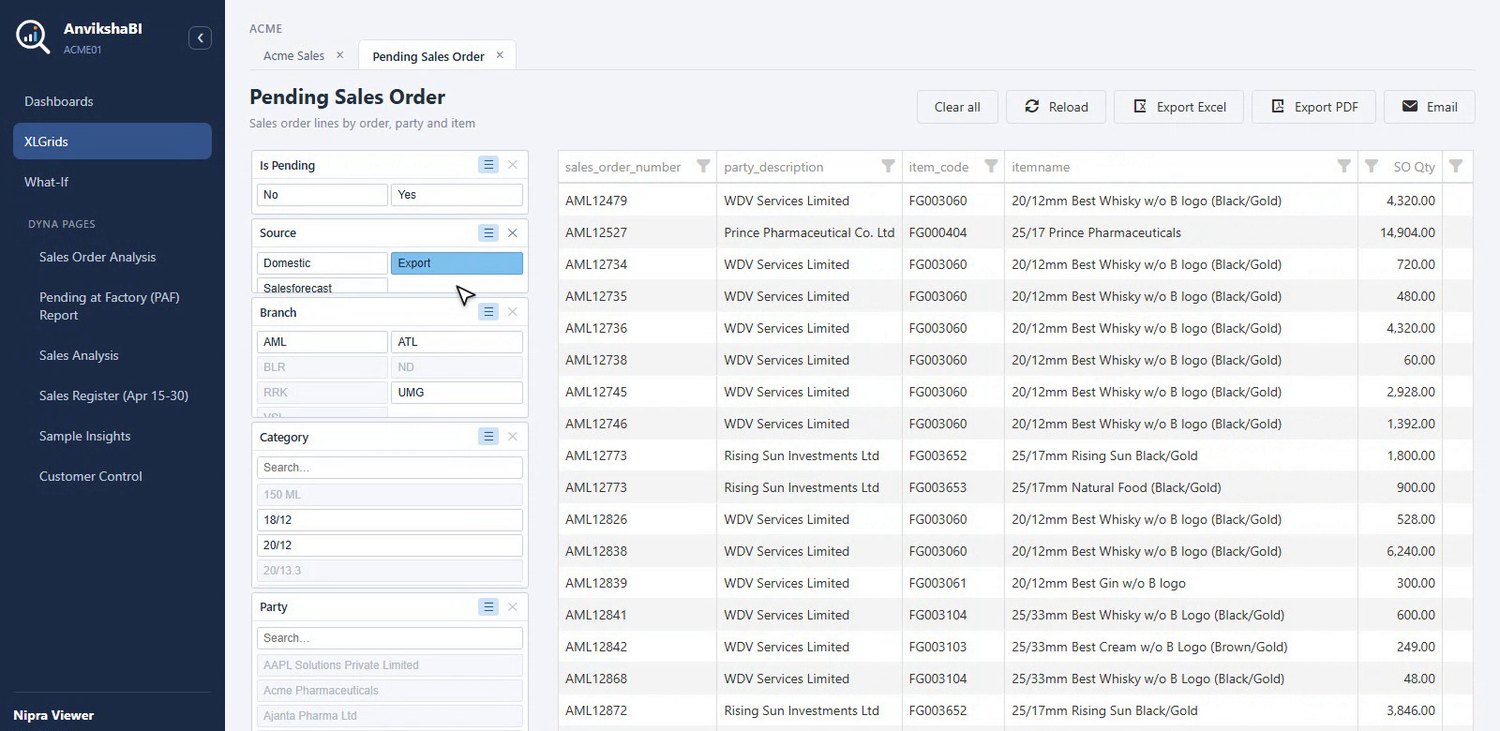
XLGrid reports
Spreadsheet-style reports: group, total and slice with one-click slicer buttons. Familiar to anyone who has used a spreadsheet, and always live.
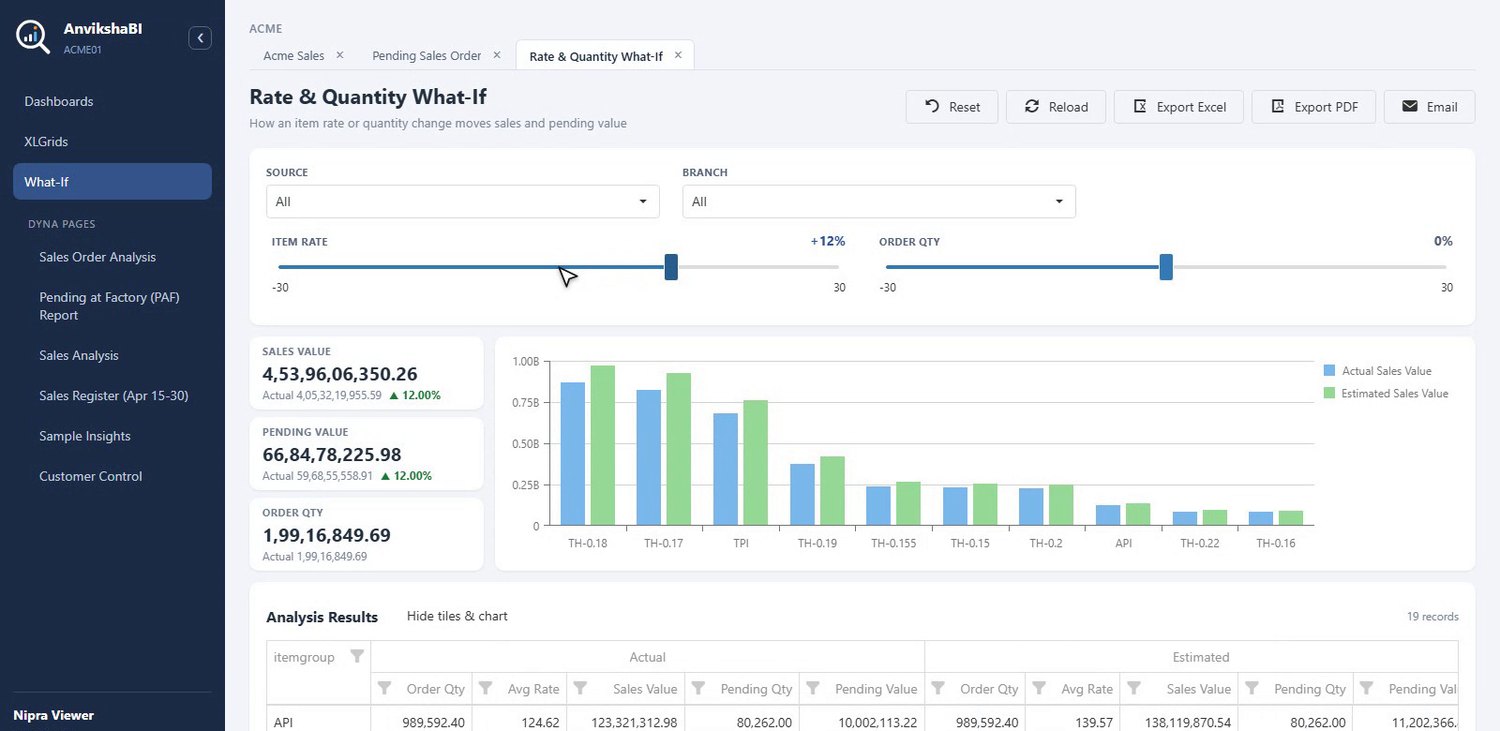
What-If analysis
Move a slider and see sales, quantity and value change at once. Drivers, formulas, bands, tiles and a chart, with nothing saved against the real data.
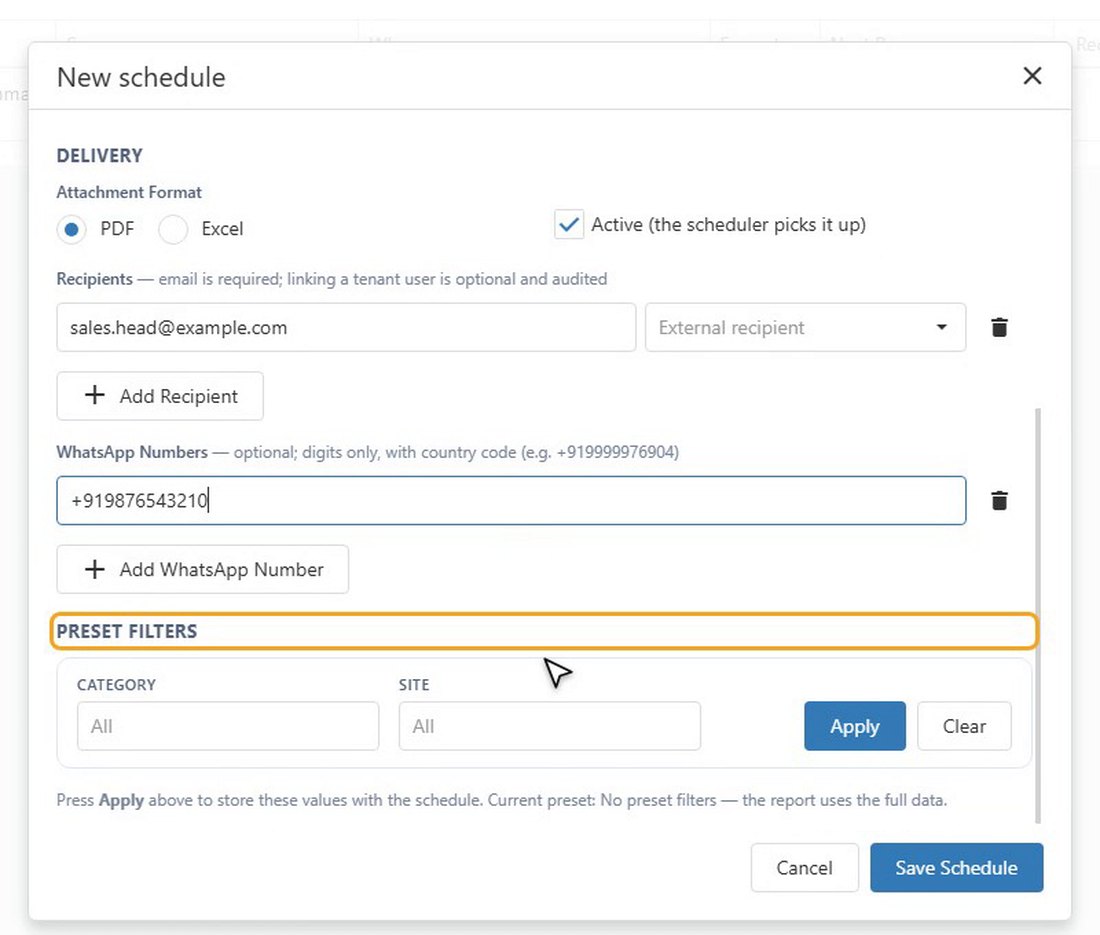
Scheduled email & WhatsApp
Send any dashboard as a PDF or Excel file on a daily, weekly or monthly schedule, to email addresses and WhatsApp numbers, with a history of every run.
PDF & Excel export
One click to export a dashboard to PDF or a table to Excel, with KPI arrows, currency and compact K / M formats carried into the file. Export rights are granted per person.
Secure, multi-tenant
Every company works in its own isolated space. Control who can view, edit, export and email each dashboard, and review activity in the audit trail.
From a connection to a shared report in four steps
Connect
Point AnvikshaBI at your data: MySQL, SQL Server, PostgreSQL, Oracle, SQLite, REST APIs, CSV, Excel, JSON, Google Sheets or your ERP.
Model
Save a query as a data model. Add calculated columns and measures, keep it live or cached, and refresh it automatically.
Visualise
Drag widgets onto a dashboard, build an XLGrid report or a What-If analysis, and set the formats and filters.
Share
Give each person the right access, then let reports reach them by email or WhatsApp on a schedule.
Built for the people who read the numbers
Dashboards that answer questions
Filter once and every widget responds. Point at a chart for exact values, sort a table, then export or email the result.
- Category and site filters across the whole page
- KPI arrows, currency and compact K / M number formats
- Export to PDF or Excel, or email it straight from the page
Reports that feel like a spreadsheet
Totals by group, column search and filter, and slicer buttons that narrow the grid and each other.
- Group, total and sort without writing formulas
- Slicers for lists and date ranges
- Export Excel and PDF for people who have the right
Ask “what if?” before you decide
Change an assumption such as rate or quantity and watch the estimate, the tiles and the chart update straight away.
- Drivers from your data, formulas you define
- Bands, tiles and a comparison chart
- Nothing is saved, so every viewer can explore freely
Reports that deliver themselves
Choose the dashboard, the day and time, the format and the people. AnvikshaBI sends it and keeps the run history.
- Daily, weekly or monthly, in your timezone
- Email recipients and WhatsApp numbers
- Preset filters, run now, history and edit
Video guides, step by step
Short screen recordings that show every screen, from signing in to scheduled reports. Each one opens on YouTube.
Getting started


Build your reports
 DataSource creation and editing
 DataModel creation and editing
 Widget creation and editing
 Gauge widgets
 Map widgets
 Dashboard creation and editing
 BIGrid creation and editing
 What-If analysis creation and editing
Deliver and share

The right access for every person
- Designers connect data, build dashboards, XLGrids and What-If analyses.
- Viewers open what is shared with them, filter, export and email.
- Administrators manage users, data sources, schedules and tenant settings.
- Per-person rights for view, edit, PDF, Excel and email on each report.
- Audit trail of who did what, and a tenant-wide user limit and subscription date.
Fit it to the way you work
- Dyna Pages: purpose-built pages for a specific report, in your own layout.
- Plugin pages: embed your own web page and give it governed access to selected models.
- ERP sign-in: open AnvikshaBI from your ERP without a second login.
- Google Sheets and files as data sources, for teams that live in spreadsheets.
See AnvikshaBI on your own data
Tell us what you report on today and we will show you how it looks in AnvikshaBI.
Emailinfo@quiqgenie.com